Cost Engineering Technology
From cost data
to cost decisions.
Build transparent Should Cost models, challenge supplier pricing, simulate cost drivers, define target costs and track optimization opportunities — in one Cost Engineering platform.
Built for Cost Engineers.
Understandable for decision makers.
Developed by Carbon & Cost Consulting GmbH
Supplier Quote
€197.82
Should Cost
€152.80
Gap
−22.8%
Annual Potential
€450k
The Costixx Workflow
One platform.
Five steps from data to action.
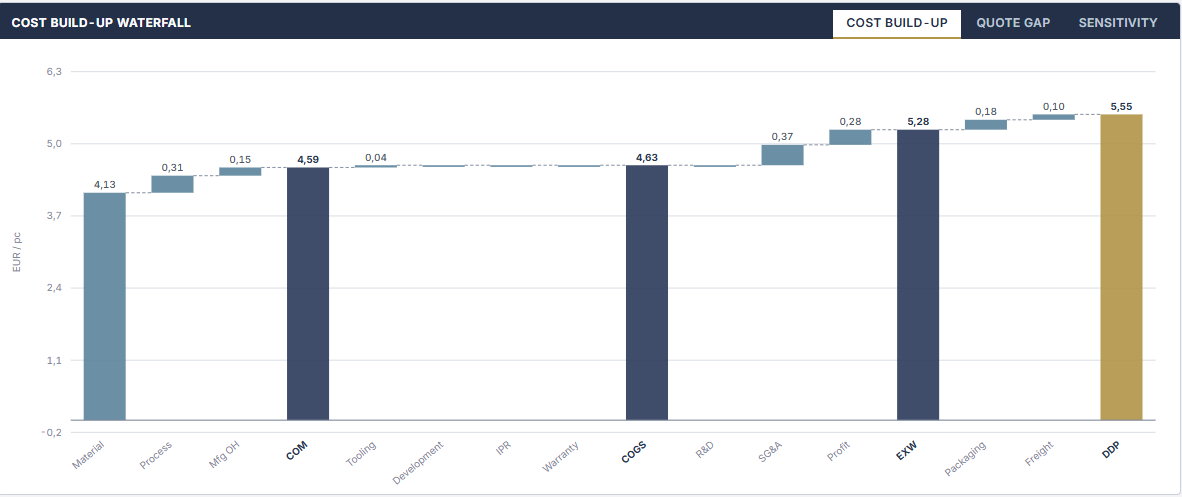
Build the cost from the ground up.
Bottom-up cost models built from the actual product and its manufacturing process — the modeling workspace of the platform.
Estimate Levels
The right estimate
for every stage.
Costixx supports five levels of cost estimation — from early concept assumptions to detailed, validated Should Cost models. The level of detail increases as product, process and manufacturing data become available.
Indicative estimate ranges only. Actual accuracy depends on data quality, product maturity, process definition and validation level.
Project stage
Supplier Validation / Negotiation
Available data
Detailed / validated
Modeling approach
Bottom-up manufacturing Should Cost
Typical use
Supplier negotiation, target setting and cost validation
Typical basis
Cost intelligence introduced
Detailed and validated project / supplier data
Data maturity
Model detail
As the data matures, the model evolves.
L5
Reference & regional data
L4
Product parameters
L3
BOM & component data
L2
Process, machine & labor data
L1
Validated client & supplier data
One platform.
Different levels of cost certainty.
Start with the data available today and progressively refine the cost model as product and manufacturing information matures.
Start with what you know. Refine as you know more — from early estimate to detailed Should Cost.
Client-specific cost intelligence
Where does that cost data come from?
Build on actual cost data.
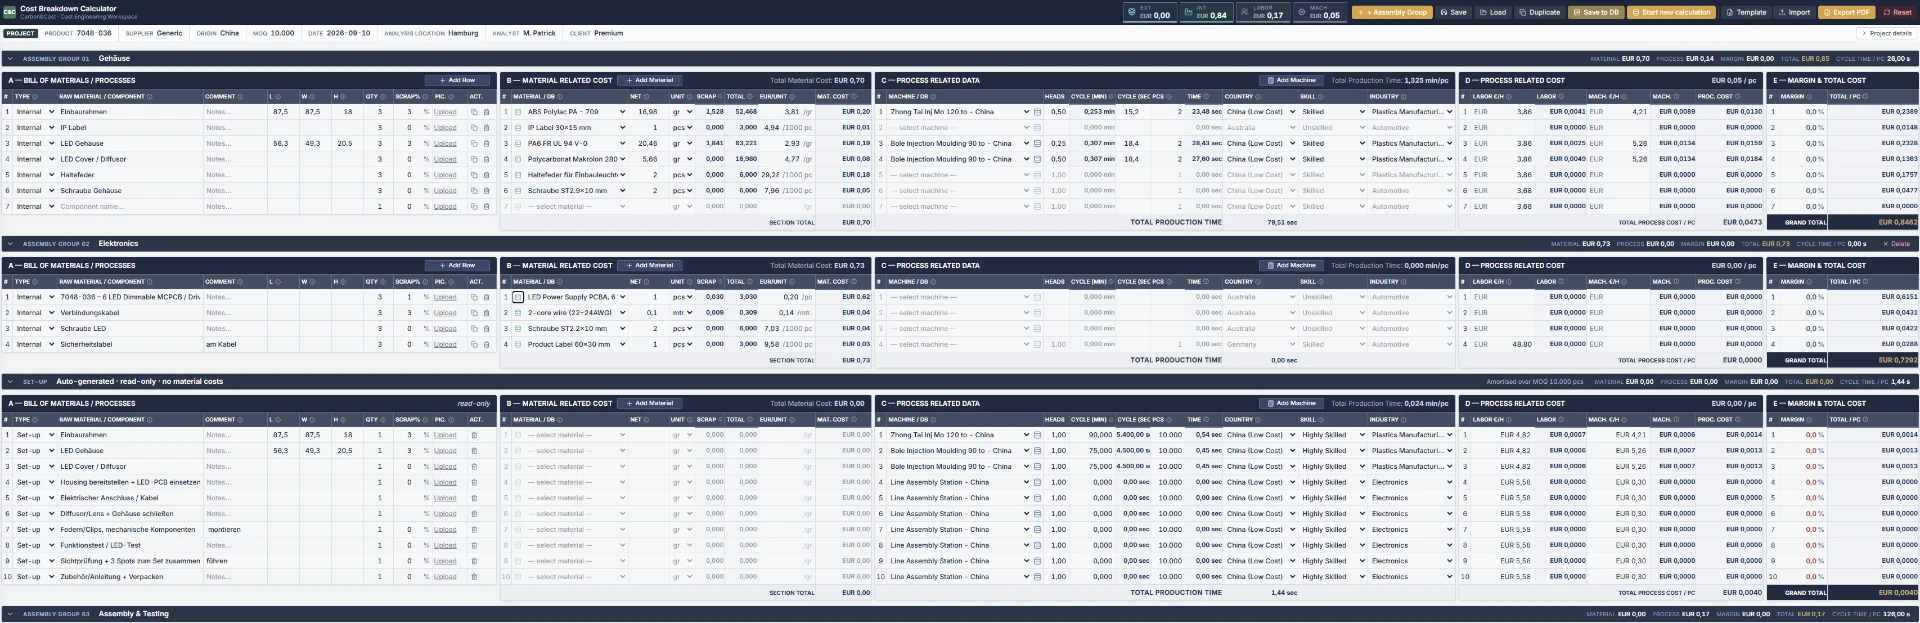
Costixx structures the cost data behind the model around the actual client, project, supplier and manufacturing environment. Material prices, component costs, machine economics, labor rates, regional parameters and currencies can be prepared and maintained specifically for the Cost Engineering task.
Reference data may support the analysis, but the Cost Engineering model can progressively be replaced, refined and validated with actual project and client-specific data.
Actual client & project data.
Not generic database assumptions.
- Materials
- Components
- Machines
- Labor
- Countries
- Currencies
Cost Intelligence Layer
Structured, project-specific data
Cost Model
Product & process build-up
Cost Decision
Negotiation, design, sourcing
Cost intelligence domains
Materials DB
Material Cost Intelligence
Cost, carbon and traceability in one data record.
Traceable
Every cost assumption retains its source and reference.
Validated
Separate data origin from its validation status.
Context-specific
Define whether data applies globally, by country, client, supplier or project.
Categories
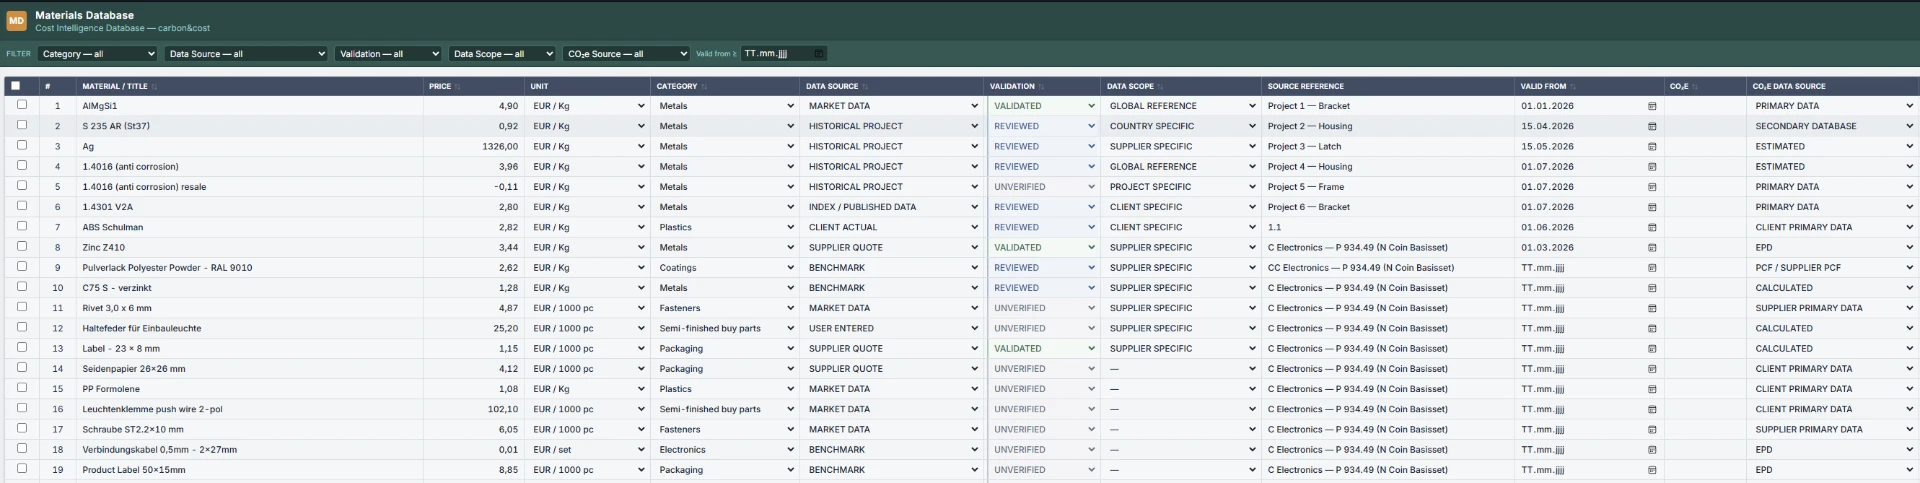
Every material price carries its data source, validation status, data scope, source reference and validity date — so the model shows where the price comes from and how far it is validated.
Traceability
From data to decision
- Material price
- Component price
- Machine economics
- Labor rate
- Regional data
- Currency
Product & process cost model
Should cost
The databases are working inputs of the calculation — every cost result stays connected to the assumptions behind it.
From reference data to validated cost intelligence.
Reference / initial data
Used when project-specific information is not yet available.
- Regional assumptions
- Reference prices
- Initial machine assumptions
- Initial labor assumptions
Refine & validate
Data is progressively replaced as the project matures.
- Project data
- Supplier information
- Current market data
- Manufacturing information
Client-specific cost intelligence
The Cost Engineering model runs on validated inputs.
- Actual project assumptions
- Actual supplier conditions
- Actual manufacturing environment
- Validated Cost Engineering inputs
The cost model is only as good as the data behind it.
Costixx creates traceability from the underlying cost assumption to the resulting product cost.
Traceable
Know which data drives the calculation.
Project-specific
Build the model around the relevant product, supplier and manufacturing environment.
Updatable
Maintain cost assumptions as market, project and manufacturing conditions change.
Supplier intelligence
What is behind the supplier price?
Turn supplier pricing into a fact base.
Costixx rebuilds supplier pricing from the manufacturing side — material, process, machine, labor, tooling, overhead, logistics and commercial assumptions.
The result is not simply a price comparison. It is a transparent explanation of where the supplier price differs from the calculated Should Cost.
Don't just negotiate the price.
Understand what creates it.
Cost engineering journey
- 01
Supplier quote
Commercial starting point
- 02
Should cost
Manufacturing-based model
- 03
Cost gap
Quantified difference
- 04
Cost drivers
Explain the difference
- 05
Negotiation fact base
Actionable commercial position
Illustrative Costixx example
Single part · annual volume
Supplier quote
€197.82
/ pc
Should cost
€152.80
/ pc
Gap
−€45.02
/ pc · −22.8%
Annual potential
€450k
per year
Illustrative Costixx example. Results depend on the product, supplier, manufacturing process, data quality and project conditions.
Supplier analysis
Supplier gap analysis
Quantify the commercial gap.
Convert the difference between supplier pricing and calculated Should Cost into a quantified commercial position.
Quantified output
- Supplier quoteCommercial price submitted
- Should costBottom-up calculated cost
- Absolute gapEUR per piece
- Percentage gapShare of supplier price
- Annual impactGap × annual volume
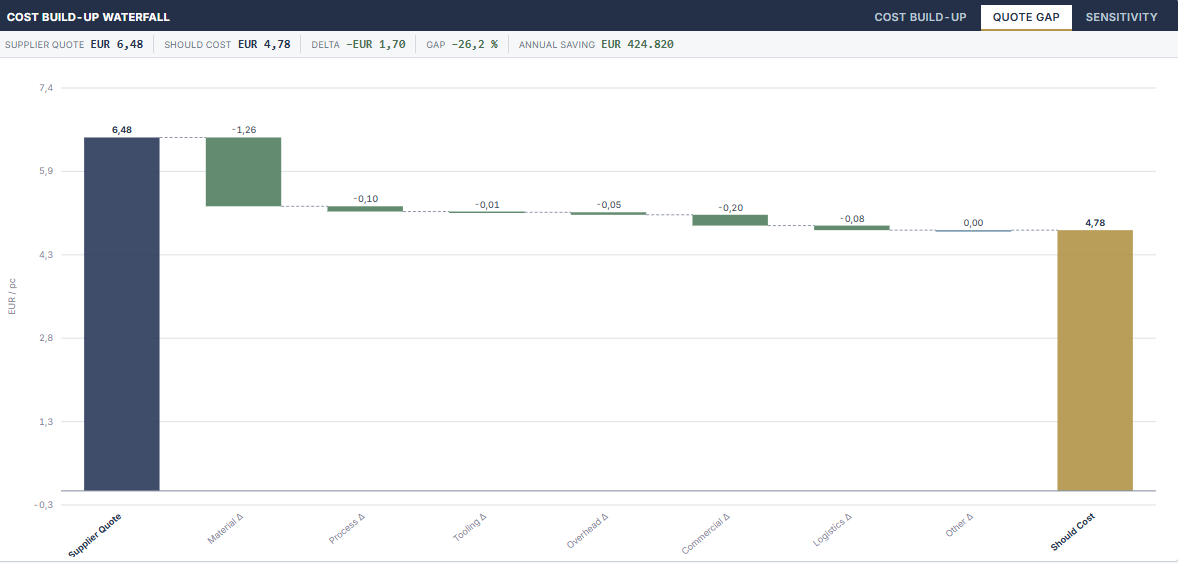
From cost gap to negotiation fact base.
Price negotiation
- Supplier price
- Requested target
Two numbers, no explanation of what creates the difference.
Fact-based negotiation
- Material assumption
- Manufacturing process
- Cycle time
- Machine rate
- Labor
- Tooling
- Overhead
- Logistics
- Commercial assumptions
Negotiate the cost drivers,
not just the final price.
Traceability
Every commercial gap can be traced back to the underlying cost assumption.
Costixx supplier intelligence delivers
- Supplier cost breakdown
- Quote analysis
- Cost driver validation
- Machine rate analysis
- Labor rate analysis
- Material benchmarking
- Tooling validation
- Investment validation
- Negotiation preparation
A cost gap tells you how much. Cost Engineering tells you why.
Once the drivers behind the gap are understood, Costixx can simulate what happens when they change.
Next: Sensitivity & scenarios →
Cost driver intelligence
Know what moves the cost. Simulate what happens next.
Costixx quantifies how individual cost drivers influence product cost and allows multiple assumptions to be combined into scenarios.
Sensitivity
Where is the economic leverage?
Scenarios
What happens when several assumptions change together?
Simulation mode
DDP cost sensitivity
Where is the economic leverage?
Sensitivity Analysis changes one cost assumption at a time while keeping the baseline model unchanged. This quantifies how strongly each driver influences product cost and annual commercial exposure.
Analytical logic
- 01Baseline should cost
- 02Change one driver
- 03Recalculate DDP
- 04Measure cost impact
- 05Rank cost drivers
Sensitivity range
The selected range determines the simulated change applied to the cost driver.
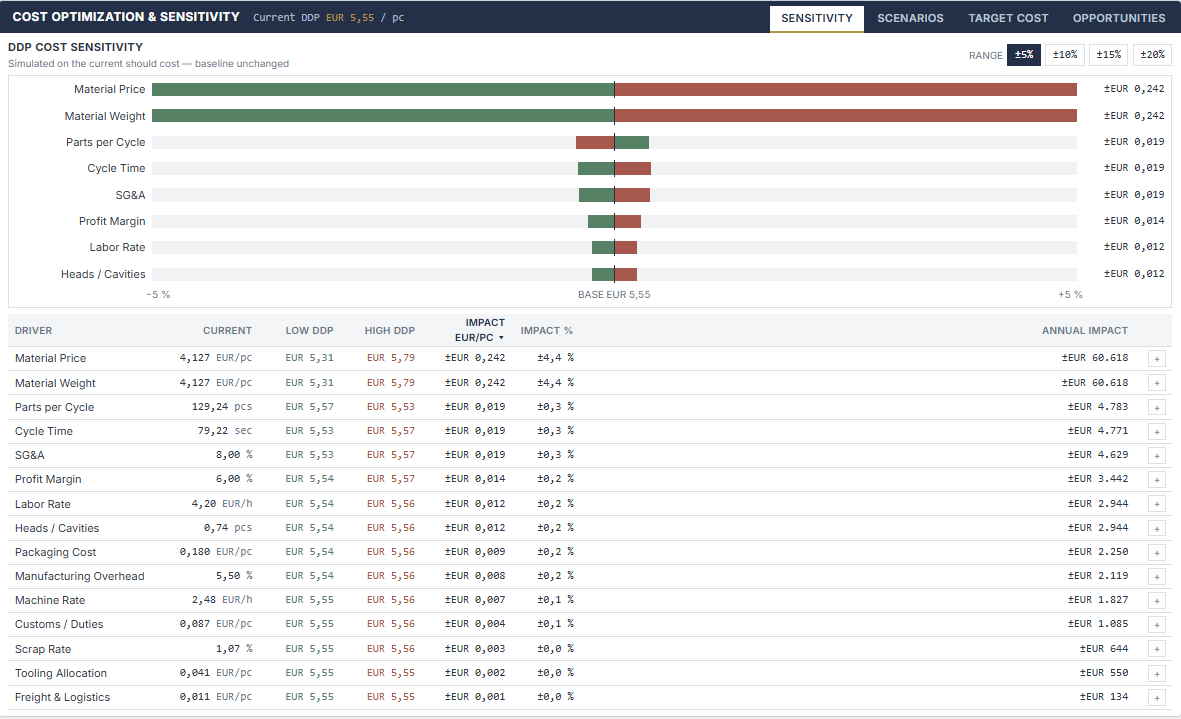
Simulated drivers
The actual ranking is not fixed — it depends on the current cost model.
Sensitivity output
- Current
- Low DDP
- High DDP
- Impact EUR / pc
- Impact %
- Annual impact
From technical assumption
to commercial impact.
Reading the driver chart
Green side
Modeled cost reduction direction — a lower calculated cost, not automatically a realized saving.
Baseline
The current Should Cost model before any assumption is changed.
Red side
Modeled cost increase direction when the selected driver moves the other way.
Sensitivity vs. scenarios
Sensitivity
One driver at a time
- Question
- Where is the greatest economic leverage?
- Purpose
- Identify and quantify how strongly individual cost drivers influence product cost.
- Output
- Impact / pcImpact %Annual impact
A high sensitivity means high economic leverage. It does not automatically mean the parameter can realistically be changed, or that the modeled impact can be realized as a saving.
Sensitivity → Identify economic leverage
Scenarios
Multiple drivers together
- Question
- What happens when several assumptions change together?
- Purpose
- Evaluate alternative manufacturing and commercial conditions.
- Output
- Scenario DDPCost structure deltaAnnual impact
A scenario impact is a modeled economic effect of changing multiple assumptions — not a realized saving.
Scenarios → Test the combinations
Questions Costixx can evaluate
- 01What happens if cycle time improves?
- 02What happens if material price changes?
- 03What happens if production moves to another cost environment?
- 04What happens if parts per cycle increase?
- 05What happens if labor content changes?
- 06What happens if material weight is reduced?
- 07What happens when several of these changes occur together?
Assumptions stay traceable
Scenario inputs are not isolated percentages. Each assumption connects back to the Cost Intelligence layer.
Identify economic leverage. Test alternative assumptions. Define what must change.
Knowing what could change is not the same as knowing what must change.
Sensitivity identifies where the greatest economic leverage exists. Scenarios test what happens when multiple assumptions change together. Target Cost defines what must change to achieve the required cost outcome.
01
Where is the leverage?
Sensitivity
02
What if we change it?
Scenario
03
What must change?
Target cost
04
How do we implement and track it?
Opportunities
Target cost engineering
Define the target. Quantify what must change.
What must change
to reach the target?
A target cost defines the required economic outcome. Costixx translates the gap between the current Should Cost and the target into quantified changes across selected engineering and commercial cost levers.
From cost target
to quantified requirements.
01
Current DDP
€5.55 / pc
02
Target DDP
€4.58 / pc
03
Required reduction
€0.97 / pc
04
Required reduction
17.5 %
05
Annual impact required
≈ €243k
Illustrative Costixx example
Model-specific example — not typical customer results
A target price is a number. A target cost solution explains what has to change.
Costixx does not subtract a percentage from the current cost. It translates the required cost reduction into explicit cost-driver changes.
Levers & constraints
Optimize only what can realistically change.
Not every sensitive cost driver is automatically an optimization lever. Costixx allows the user to define which drivers may contribute to the target-cost solution and to constrain the maximum permitted change for each selected driver.
High sensitivity≠automatic optimization lever
Economic leverage+feasibility+constraint=target cost lever
Lever selection — enabled / disabled and maximum permitted change
Illustrative constraint settings
A maximum change is a user-defined optimization constraint. It does not imply that the change is automatically achievable.
Target cost solution
Translate the target into quantified levers.
Strategy: balanced
The target cost solution distributes the required cost reduction across the selected levers according to the chosen optimization strategy, within the defined constraints.
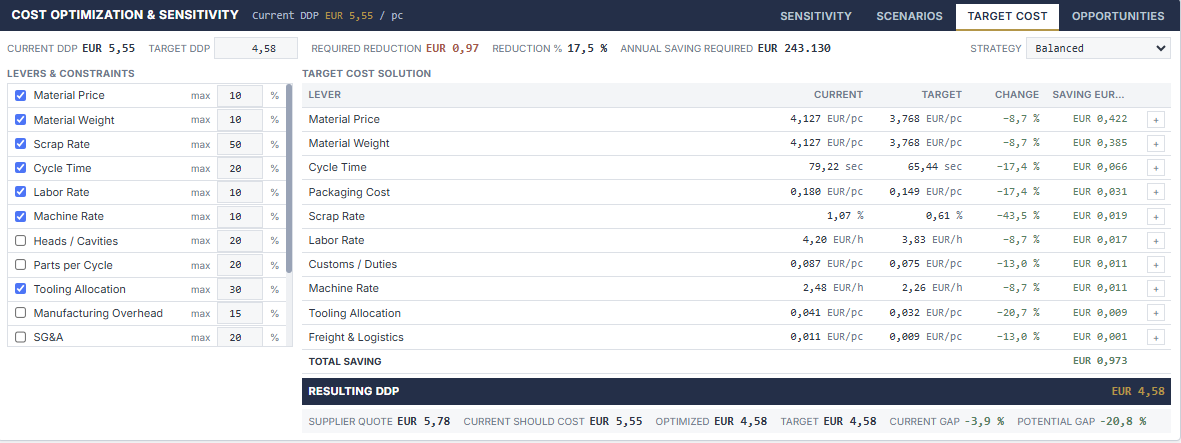
Methodology
The interface above provides the numerical evidence: for each selected lever it shows the current value, the target value, the required change and its economic effect on the total cost. Costixx does not distribute the reduction arbitrarily — it respects the constraints defined per lever and the selected optimization strategy.
Engineering interpretation
A quantified required change is a specification for engineering work, not a result. Each lever must be reviewed against process capability, product design, manufacturing conditions and commercial reality before it can be accepted.
Values are model-specific and illustrative. They do not represent typical results.
Target solution logic
- 01Target cost
- 02Required cost reduction
- 03Select feasible levers
- 04Define constraints
- 05Quantify required changes
- 06Target cost solution
A calculated target cost solution is not yet an implementation plan.
From sensitivity to target cost
Sensitivity
Where is the economic leverage?
Target cost
Which of those drivers should contribute to the required cost outcome?
Sensitivity identifies economic leverage. Target Cost converts selected and constrained levers into required changes — the methodological bridge between analysis and optimization.
Scenario vs. target cost
Scenario
What if these change?
- Input
- Assumption changes
- Output
- Resulting cost
Target cost
What must change?
- Input
- Required cost
- Output
- Required lever changes
A required change is not yet an opportunity.
Before a modeled target lever becomes an optimization opportunity, its technical and commercial feasibility must be evaluated.
From target lever to engineering question
Can process sequence, line balance, automation, work content or equipment utilization be improved?
These are engineering questions. A modeled change is not automatically feasible.
The model tells us what has to change. Engineering determines how it can change.
From cost model to physical validation on the shop floor
Knowing what must change does not yet make it happen.
Target Cost translates the required cost outcome into quantified engineering and commercial levers. The next step is to turn feasible levers into structured optimization opportunities and track them through implementation.
Sensitivity
Where is the economic leverage?
Scenario
What if we change it?
Target cost
What must change?
Opportunities
How do we implement and track it?
Opportunity management
Turn cost intelligence into measurable action.
How do we implement
and track it?
Costixx converts identified cost levers and engineering findings into structured opportunities with quantified economic potential, feasibility, effort and implementation status.
Finding the opportunity is not the result.
Realizing it is.
Where opportunities come from
Opportunities can start anywhere in the Cost Engineering process.
What matters is that every opportunity becomes quantified, evaluated and traceable.
- 01Supplier analysisCommercial / cost gap findings
- 02SensitivityEconomic leverage
- 03Target costRequired target levers
- 04VA / VEProduct and design improvements
- 05On-site validationActual process findings
- 06Shop-floor analysisCycle time, line balance, utilization, scrap, material and process opportunities
→ Opportunity pipeline
These are opportunity types, not automatically achievable savings. Each requires validation before its economic effect can be treated as realizable.
Opportunity register
Every opportunity quantified, evaluated and tracked.
Illustrative / anonymised project data
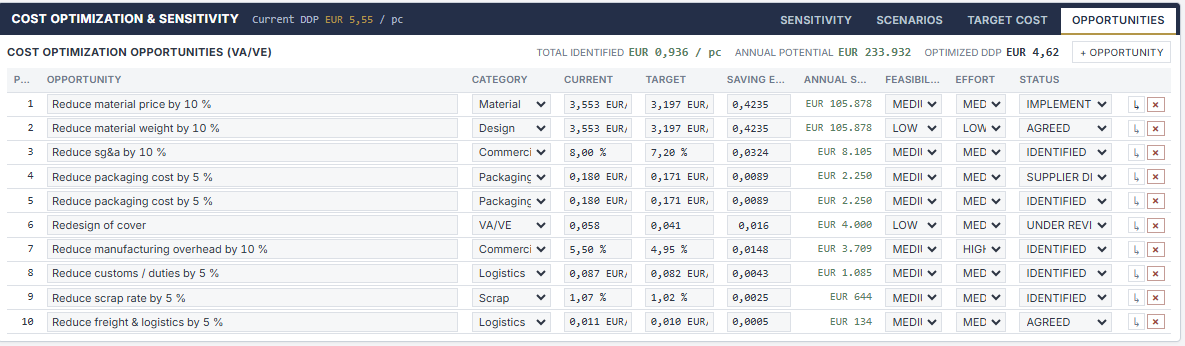
From lever to opportunity
- 01Economic leverage
- 02Target / optimization lever
- 03Engineering or commercial action
- 04Opportunity
- 05Quantified potential
A lever describes what influences the cost. An opportunity describes what we can actually do about it.
Action
What specifically should change?
Baseline
What is the current condition?
Target
What should the future condition be?
Economic potential
What is the modeled impact per part and annually?
Feasibility
Can it technically / commercially be achieved?
Effort
What is required to implement it?
Status
Where is it in the implementation process?
Potential is not realized impact.
Economic potential becomes realized impact only when the underlying action is validated, implemented and the result is confirmed.
Feasibility × economic impact
Prioritize what matters and what can actually be done.
Economic impact alone does not determine priority. Costixx combines economic potential, feasibility, effort and status to support implementation decisions.
Implementation journey
The journey describes the conceptual progression of an opportunity. Status labels in the application follow the terminology of the Costixx opportunity register.
Keep the opportunity connected to the cost model.
An opportunity should not become an isolated action item. It remains connected to the underlying cost driver, baseline, target and modeled economic impact.
- 01Cost model
- 02Cost driver
- 03Opportunity
- 04Target
- 05Implementation
- 06Result
Result → updated cost model
Closed-loop cost engineering
A validated condition becomes part of the updated cost baseline.
Once an opportunity is implemented and validated, the confirmed manufacturing or commercial condition can become part of the updated cost model.
01
Modeled impact
Calculated effect of changing an assumption.
02
Opportunity potential
Quantified effect associated with a feasible action.
03
Implemented action
Approved change executed in the product, process or commercial setup.
04
Realized impact
Confirmed result after implementation.
Engineering opportunity
Commercial opportunity
Not every opportunity is a physical process change. Costixx supports engineering and procurement decisions in the same structure.
Some opportunities are found in the model. Others are found on the shop floor.
Physical observation and on-site validation can reveal opportunities that are not visible from quotation or database analysis alone.
Data shows where to look.
The shop floor shows what is actually possible.
Illustrative opportunity
From one opportunity to an optimization portfolio.
Opportunities can be structured and reviewed across the dimensions of the project setup.
Management view — progression
Identified potential
Validated potential
In implementation
Realized impact
Indicative progression only. The purpose is to show how economic potential narrows toward verified results — not to state performance figures.
Traceability
From source data to realized impact.
The Costixx journey
01
Build
Build the cost.
02
Intelligence
Build on traceable data.
03
Analyze
Understand the drivers.
04
Optimize
Define what must change.
05
Track
Turn opportunities into results.
Closed-loop cost engineering
From Should Cost
to realized impact.
Costixx connects cost modeling, supplier intelligence, cost-driver analysis, target cost engineering and opportunity tracking in one traceable Cost Engineering workflow.
Cost engineering doesn’t end
with a should cost.
It ends with
a verified result.
Costixx does not just calculate cost. It connects:
Ready to turn cost transparency into measurable results?
See how Costixx can support your Should Cost, supplier analysis, target cost and cost optimization workflow.
Developed by Carbon & Cost Consulting GmbH — built from hands-on Cost Engineering and manufacturing practice.